
创建项目
先正常创建一个 spring boot 项目,这里需要说明的一点,没有使用 spring-boot-starter-parent, 而是使用 spring-boot-dependencies 在 dependencyManagement 中引入。
|
1 2 3 4 5 6 7 8 9 10 11 12 |
<dependencyManagement> <dependencies> <dependency> <!-- Import dependency management from Spring Boot --> <groupId>org.springframework.boot</groupId> <artifactId>spring-boot-dependencies</artifactId> <version>2.3.1.RELEASE</version> <type>pom</type> <scope>import</scope> </dependency> </dependencies> </dependencyManagement> |
启用 Actuator 模块
Spring Boot 本身内置了生产级别的属性特征,包括监控和管理应用状态。可以通过 Http API 或者 JMX 获取到这些状态。首先启用这个模块,引入依赖 spring-boot-starter-actuator 即可。
|
1 2 3 4 |
<dependency> <groupId>org.springframework.boot</groupId> <artifactId>spring-boot-starter-actuator</artifactId> </dependency> |
actuator 默认开放了 info, health 的 http 接口,这样通过 http://127.0.0.1:8080/actuator/info, http://127.0.0.1:8080/actuator/health 就能访问到相关信息。
actuator 有 prometheus 接入点,需要显示的打开。actuator 把统计的指标暴露给 Prometheus Server, 需要引入 micrometer-registry-prometheus, 在 pom.xml 中添加
|
1 2 3 4 |
<dependency> <groupId>io.micrometer</groupId> <artifactId>micrometer-registry-prometheus</artifactId> </dependency> |
在 application.properties 添加以下内容, 我们把 endpoint 默认关闭,只打开我们需要的。 通过 management.endpoints.web.exposure.include 把 http 接入点打开。
|
1 2 3 4 5 |
management.endpoints.enabled-by-default=false management.endpoint.health.enabled=true management.endpoint.metrics.enabled=true management.endpoint.prometheus.enabled=true management.endpoints.web.exposure.include=health,prometheus,metrics |
- http://127.0.0.1:8080/actuator/metrics 这里列出了目前统计的指标项
- http://127.0.0.1:8080/actuator/prometheus 这里查看详细的指标内容, 这个地址也是 Prometheus Server 采集指标的地址
自定义指标开发
prometheus 提供四种指标类型, 文档参考: https://prometheus.io/docs/concepts/metric_types/。
可以通过自定义 bean, 把 MeterRegistry 注入进来,指标的定义与统计可以通过 MeterRegistry 来做。
|
1 2 3 4 5 6 7 |
@Service public class MeterServiceImpl implements MeterService { private MeterRegistry meterRegistry; public MeterServiceImpl(MeterRegistry registry) { this.meterRegistry = registry; } } |
定义 /metric 接口来模拟服务请求。在 Controller 里可以把 MeterService 注入进来。具体代码如下
|
1 2 3 |
List<Tag> tags = new ArrayList<>(); tags.add(Tag.of("api_name", "metric")); this.meterService.countMeter("demo.metric.request.count", tags); |
countMeter 定义了name 和 tags, name 就是指标名称, tags 相当于 prometheus 中的 label。这里记录了请求的数量。
通过 访问 http://127.0.0.1:8080/metric , 然后观察 http://127.0.0.1:8080/actuator/prometheus, 可以看到自定义的指标统计,可以找到类似的记录。看到这里是不是非常简单。
|
1 2 3 |
# HELP demo_metric_request_count_total # TYPE demo_metric_request_count_total counter demo_metric_request_count_total{api_name="metric",} 4.0 |
histogram 与 summary 类似,一般用于服务时长的统计。histogram 提供不同的 bucket, 数据可以落到不同的 bucket 中。这样可以统计数据的分布情况。summary 可以根据百分比进行数据划分,很容易得出类似 99% 请求完成的时间在什么数值之下。
首先可以创建一个 Histogram 的 Timer ,MeterService 的定义如下, 其中 slos 是对应的 bucket 列表。
|
1 2 3 4 |
// 通过 max, min 时间间隔,来计算 slos Timer createHistogram(String name, @Nullable List<Tag> tags, Duration min, Duration max, long interval); Timer createHistogram(String name, @Nullable List<Tag> tags, Duration min, Duration max, Duration... slos); |
具体的使用实例如下:
|
1 2 3 4 5 6 7 8 9 10 |
Timer histogram; @PostConstruct public void init() { //histogram = meterService.createHistogram("demo.metric.request.duration", null, Duration.ofMillis(100L), // Duration.ofMillis(1000L)); // 也可以显示的指定 bucket histogram = meterService.createHistogram("demo.metric.request.duration", null, Duration.ofMillis(100L), Duration.ofMillis(1000L), Duration.ofMillis(100L), Duration.ofMillis(200L)); } |
在接口的入口处,可以生成一个计时器,服务结束时,时间间隔写入到 timer 即可。样例如下
|
1 2 3 4 5 |
Timer.Sample sample = Timer.start(); // 业务处理逻辑 ... sample.stop(histogram); |
查看 prometheus 接口,可以看到类似的数据统计:
|
1 2 3 4 5 6 7 |
# HELP demo_metric_request_duration_seconds # TYPE demo_metric_request_duration_seconds histogram demo_metric_request_duration_seconds_bucket{le="0.1",} 1.0 demo_metric_request_duration_seconds_bucket{le="0.2",} 1.0 demo_metric_request_duration_seconds_bucket{le="+Inf",} 2.0 demo_metric_request_duration_seconds_count 2.0 demo_metric_request_duration_seconds_sum 0.357743669 |
summary 使用与 histogram 类型, 生成方式稍有不同
|
1 2 |
summary = meterService.createSummary("demo.metric.request.duration.summary", null, Duration.ofMillis(50L), Duration.ofMillis(1000L)); |
最终可以看到,下面的统计结果
|
1 2 3 4 5 6 7 8 |
# HELP demo_metric_request_duration_summary_seconds # TYPE demo_metric_request_duration_summary_seconds summary demo_metric_request_duration_summary_seconds{quantile="0.5",} 0.029360128 demo_metric_request_duration_summary_seconds{quantile="0.75",} 0.401604608 demo_metric_request_duration_summary_seconds{quantile="0.9",} 0.401604608 demo_metric_request_duration_summary_seconds{quantile="0.99",} 0.401604608 demo_metric_request_duration_summary_seconds_count 2.0 demo_metric_request_duration_summary_seconds_sum 0.418467096 |
指标接入 Prometheus Server
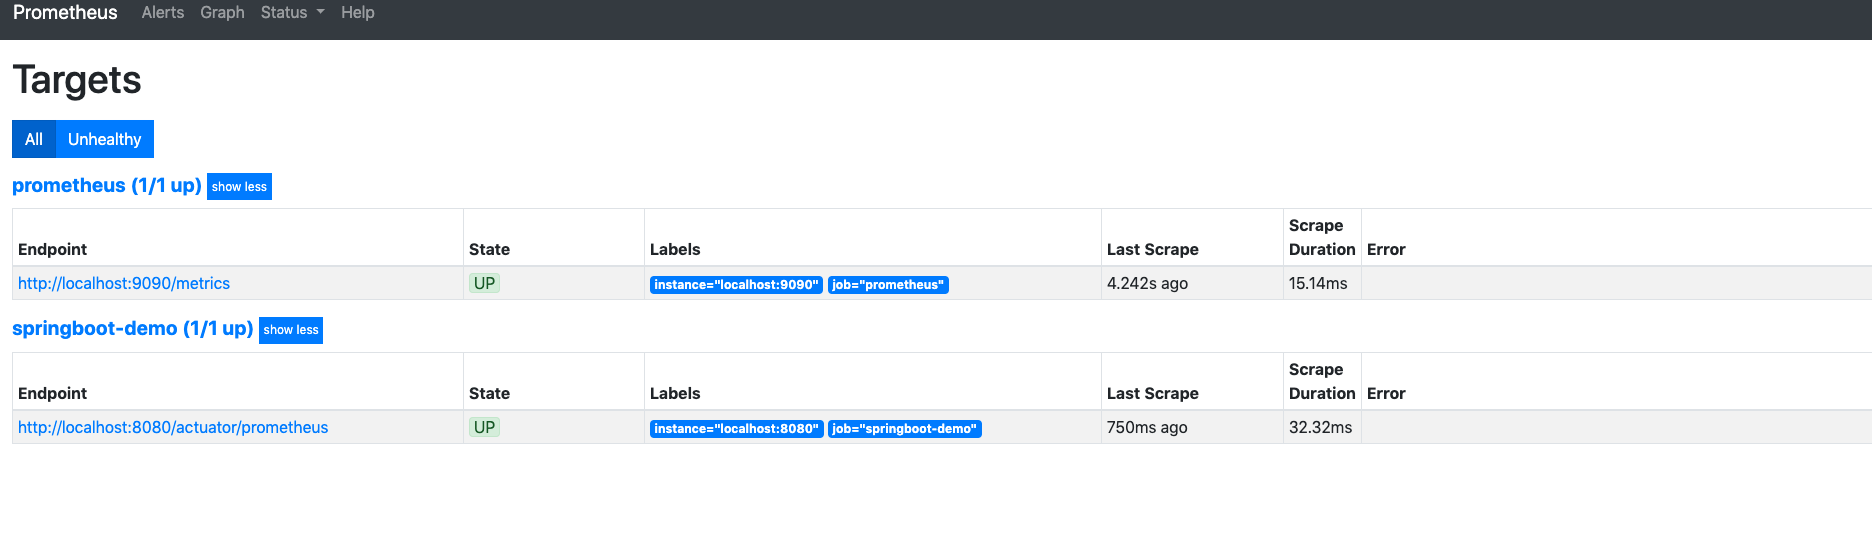
prometheus.yml 增加 job 配置, 抓取的路径为:/actuator/prometheus。启动 prometheus : ./prometheus –config.file=prometheus.yml 。
|
1 2 3 4 5 6 7 |
- job_name: 'springboot-demo' # metrics_path defaults to '/metrics' # scheme defaults to 'http'. metrics_path: /actuator/prometheus static_configs: - targets: ['localhost:8080'] |
通过 targets 页面,就能看到 spring boot 应用的接入状态。
总结
本文介绍了如何使用 Prometheus Server 收集 Spring Boot 应用的监控数据,以及如何开发自定义的指标数据。
具体代码参考这里。